
Featuring the Prairie ESOP A&E Confidence Index
Executive Summary: What A&E Leaders Are Telling Us
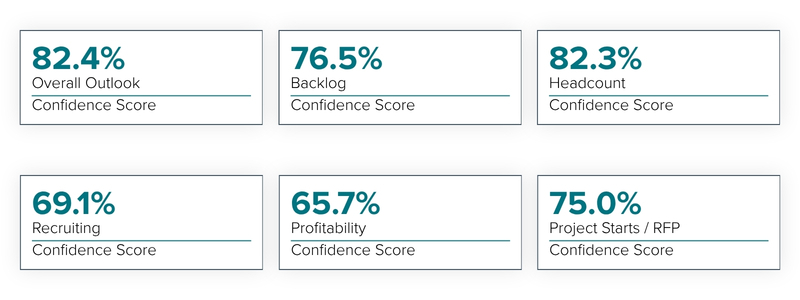
Prairie’s 4th annual Architecture & Engineering Survey reflects broad optimism among ESOP-owned architecture and engineering (“A&E”) firms heading into 2027. The inaugural Prairie ESOP A&E Confidence Index registered 75.0%, well above the 50.0% threshold that signals expansion. Respondents reported particularly strong expectations for headcount and their overall business outlook, while confidence in backlog growth and new project activity also supports a positive near-term outlook. Profitability expectations remained favorable but were more measured than other components of the index.
Looking ahead, the primary challenge may be converting strong demand into profitable growth. Firms expect to expand their workforces and pursue new project opportunities, but continued difficulty recruiting experienced talent and pressure on labor costs could constrain execution and margins. Against that backdrop, respondents are investing in artificial intelligence (“AI”) and other technology, strengthening employee-ownership practices and focusing on long-term ESOP sustainability.
- Industry confidence remains strong, with the inaugural Prairie ESOP A&E Confidence Index reaching 75.0%.
- Workforce growth is expected to continue. The 82.3% Headcount Confidence Score was among the index’s strongest components.
- Overall business sentiment is positive as the Overall Outlook Confidence Score reached 82.4%, the highest of the six index components.
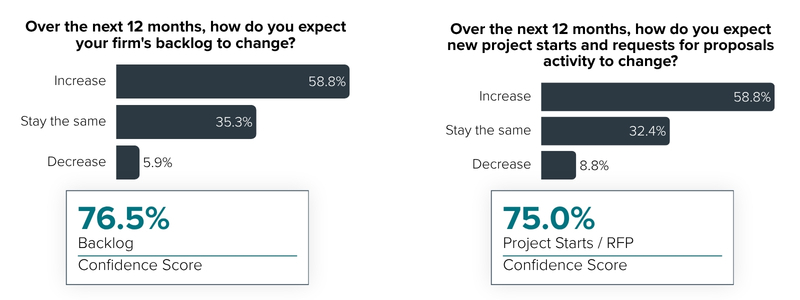
- Backlogs and new project activity support expansion, reflected in confidence scores of 76.5% for backlog and 75.0% for project starts and requests for proposals (“RFPs”).
- Profitability expectations remain favorable but measured. At 65.7%, profitability received the lowest confidence score among the six components.
- Technology and AI investment remain a priority for firms evaluating how these tools can support project delivery, design, business development and proposals.
- ESOP ownership supports workforce strategies by helping firms strengthen recruiting, retention and employee engagement.
- ESOP sustainability planning is receiving attention, with nearly two-thirds of respondents having completed a sustainability study.
Respondent Profile: Ownership and ESOP Age
What the Data Shows
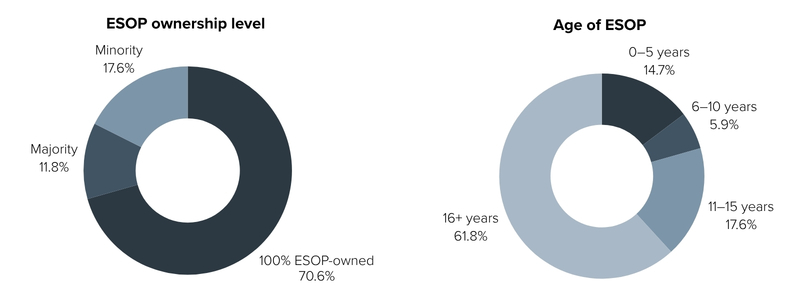
- Respondents generally represent established, highly employee-owned firms. More than two-thirds are 100.0% ESOP-owned and nearly four out of five have operated as ESOPs for more than 10 years, reflecting considerable experience with employee ownership.
- Our survey captures perspectives from a sample of the broader ESOP population. The National Center for Employee Ownership (“NCEO”) counts 6,411 ESOP companies nationwide as of March 2026, and A&E firms represent roughly 45.0% of the 1,246 employee-owned professional, scientific and technical services companies tracked by the U.S. Department of Labor. Certified EO estimates that approximately 559 A&E firms currently maintain ESOPs across the U.S.
Respondent Profile: Revenue and Employees
What the Data Shows
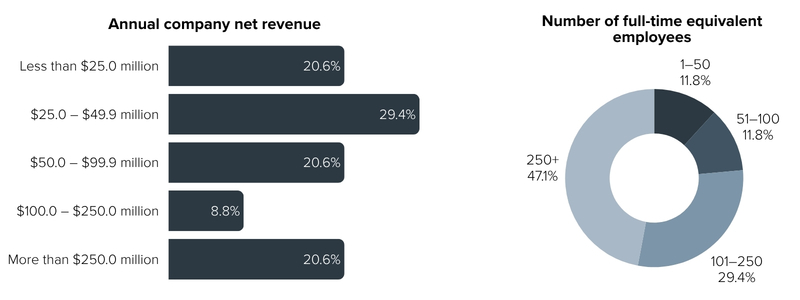
- Revenue is distributed across several firm-size categories, with firms reporting $25.0–$49.9 million in revenue representing the largest share of respondents at 29.4%. No single range accounts for a majority of the sample.
- Prairie’s respondent base differs significantly from the broader architecture market. More than three-quarters of surveyed firms employ over 100 people, while the American Institute of Architects (“AIA”) reports that 74.0% of U.S. architecture firms have fewer than 10 employees and the American Council of Engineering Companies (“ACEC”) states that 70.0% of its engineering member firms have fewer than 50 employees.
Respondent Profile: End-Markets Served
What the Data Shows
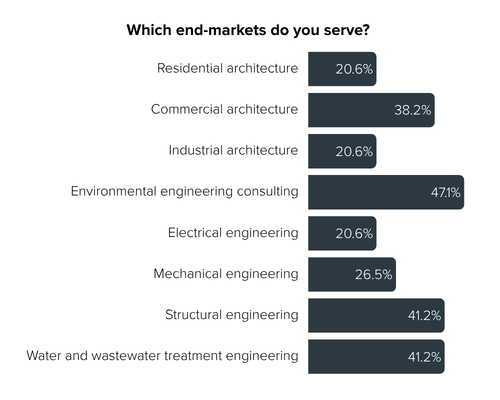
- Infrastructure-related work features prominently in the respondent mix. Environmental engineering consulting is the most frequently selected market, while structural engineering and water and wastewater treatment engineering are also common areas of practice.
- Respondents serve both building and infrastructure markets, with commercial architecture selected by 38.2% alongside several engineering specialties.
- External data provides additional context for the importance of infrastructure-related markets. ACEC’s Engineering Business Sentiment Q3 2026 report ranked Water/Wastewater among the sectors with the strongest current sentiment, reinforcing the demand signal behind respondents’ market mix.
Prairie ESOP A&E Confidence Index
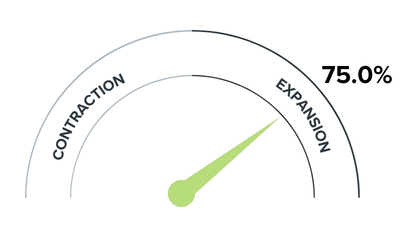
The Prairie ESOP A&E Confidence Index is a weighted diffusion index derived from Prairie’s exclusive survey of leaders at ESOP-owned architecture, engineering and combined A&E firms. Scores are built from expectations for backlog, headcount, profitability, project starts and RFP activity, the ESOP recruiting and retention advantage and overall business outlook.
A reading of 50.0% is the neutral midpoint. Any score above 50.0% signals expansion, while scores below 50.0% signal contraction.
Confidence Index: Backlog and Proposals
What the Data Shows
- Backlog confidence reflects tangible demand, not just optimism. ACEC’s Engineering Business Sentiment Q3 2026 reports a median engineering backlog of 12 months, with half of firms carrying a year or more of work.
- Existing backlogs may help explain the difference between engineering optimism and weaker architecture billings. While AIA’s August 2026 index indicated declining billings at 47.2, the substantial backlogs reported by ACEC may be supporting engineering firms’ confidence in continued project activity.
- Proposal activity signals growth, although broader architecture data remains more cautious. Nearly 60.0% of respondents expect project starts and RFP activity to increase, resulting in a 75.0% confidence score. However, AIA’s August 2026 Architecture Billings Index reported that modest growth in inquiries had not consistently translated into newly signed design contracts.
“What do we expect in 2027? A steady backlog, higher labor costs and less availability of needed staff.” – President of a transportation-focused civil engineering and construction management firm
Confidence Index: Profitability and Headcount
What the Data Shows
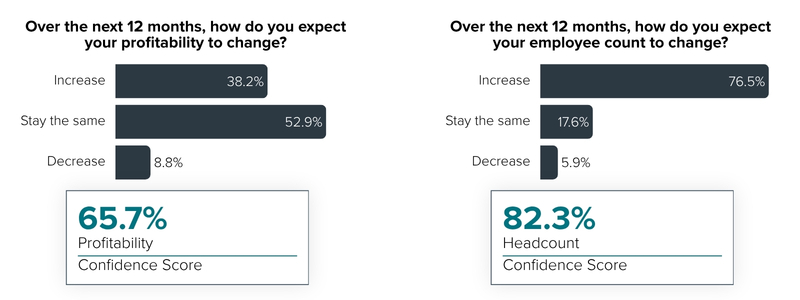
- Profitability expectations are positive but comparatively restrained. The 65.7% confidence score is the lowest component of the Prairie index, suggesting that firms anticipate growth while remaining cautious about the conditions ahead.
- Respondents to Prairie’s survey are more optimistic about headcount growth than firms in the broader engineering industry. While 76.5% of Prairie respondents expect headcount growth in the next 12 months, ACEC’s Engineering Business Sentiment Q3 2026 found a more moderate, though still positive, outlook industry-wide, with 65.0% of firms expecting to increase hiring over the same period.
- Rising labor costs may help explain the gap between growth and profitability expectations. While 76.5% of respondents expect to increase employee count, only 38.2% anticipate higher profitability, suggesting that the cost of workforce expansion could place pressure on margins.
“As a firm, we plan to evolve our pricing model to better capture value as we continue to innovate and improve client services with fewer hours to bill.” – President and CEO of a multidisciplinary environmental, planning and engineering consulting firm
Confidence Index: Recruiting and Outlook
What the Data Shows
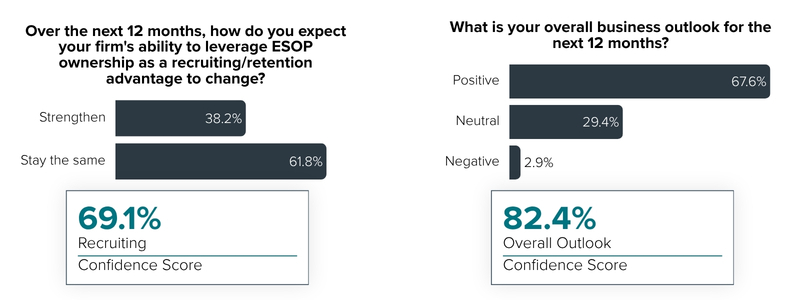
- Business leaders remain broadly optimistic about the year ahead. Overall outlook ranked highest among Prairie’s six confidence measures, even as respondents continued to identify risks.
- The ESOP recruiting advantage has room to strengthen, with most firms expecting its impact to remain stable rather than improve. This may reflect the challenge of making a long-term ownership benefit tangible to candidates and newer employees, as noted by several respondents.
“We expect business conditions in 2027 to remain generally positive, supported by continued investment across several of our key markets.” – President and CEO of an engineering, architecture, geospatial and technology services firm
Top Operational Concerns
What the Data Shows
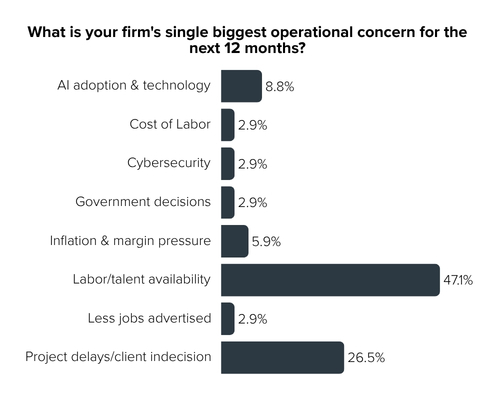
- Finding qualified talent is the clearest operational challenge, cited by nearly half (47.1%) of respondents, and nearly twice the share of the next largest operational concern.
- Staffing pressure extends beyond Prairie’s respondents: 88.0% of engineering firms in ACEC’s Engineering Business Sentiment Q3 2026 noted at least one open position.
- Project timing is the second-largest concern. More than one-quarter of respondents selected project delays or client indecision, pointing to uncertainty beyond firms’ internal staffing needs.
- AI adoption and technology remain a distant third, cited by 8.8% of respondents, a finding consistent with the continued importance of people in a labor-intensive industry.
“We expect a tight labor market and difficulty finding mid-career experts who can win the work and execute it.” – CFO of an engineering and special field services firm
ESOP Retention Effects and Education Practices
What the Data Shows
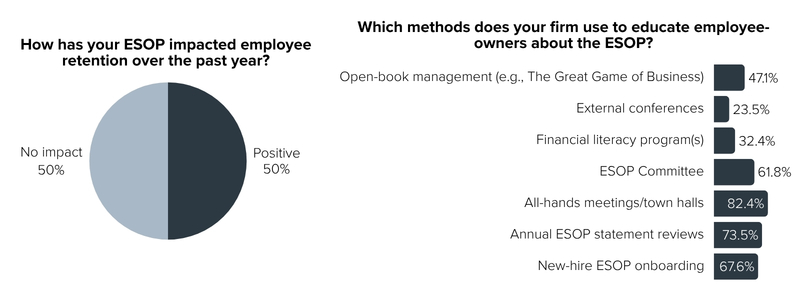
- Survey respondents reported a mixed impact of ESOP ownership on employee retention. Half of respondents say their ESOPs improved retention over the past year, while the other half report no impact.
- Firms are using multiple ways to explain employee ownership, including all-hands meetings, annual ESOP statements and new-hire onboarding. The range of approaches suggests that ESOP education is an ongoing effort rather than a single event.
- National findings also suggest that the impact of employee ownership on workers’ decisions is not straightforward. While the NCEO found that 85.0% of ESOP companies credit employee ownership with helping them attract and retain employees, many report that applicants seldom cite it as a reason for applying.
“As a 30+ year ESOP, we are committed to the ESOP model and do extensive in-person orientation…” – President and CEO of a civil engineering, planning and environmental consulting firm
In Their Own Words: ESOP Culture
In one or two sentences, how has your ESOP shaped your company’s culture or competitive position in 2026?
What Respondents Are Saying
- Employee ownership reinforces culture and shared purpose. Respondents consistently described an ownership mindset that connects individual contributions to company performance and long-term value.
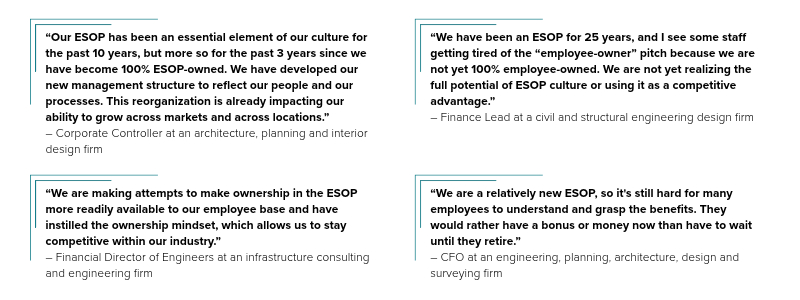
- The benefits of an ESOP take time and communication to land. Several firms, especially newer ESOPs, noted that younger or newer employees do not always connect with the model, and some would rather have cash now than a future payout.
- A few respondents flagged real trade-offs, including debt service and repurchase obligations that compete with other uses of company cash.
ESOP Sustainability Planning
What the Data Shows
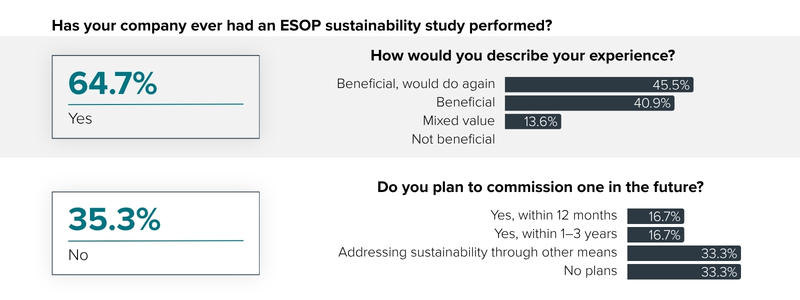
- Among firms that have completed a sustainability study, the experience is overwhelmingly positive. A majority (86.4%) of respondents described their studies as beneficial, including 45.5% who said they would commission another study, suggesting that once firms commit to studying their repurchase obligation, they find it worthwhile rather than a compliance exercise.
- Firms without a completed study are not necessarily ignoring the issue. Among firms without a completed study, one-third report plans to do so, one-third address sustainability through other means, and one-third report no current plans.
- This finding carries extra weight given our mature respondent base. With 61.8% of surveyed ESOPs in place for at least 16 years, many firms are now in the stage where repurchase obligations grow materially, and the broader ESOP community has signaled rising attention to this exact issue. The NCEO convened a trustee task force in 2026 to address gaps in how companies approach ESOP valuation and repurchase obligations.
Technology and AI Investment
What the Data Shows
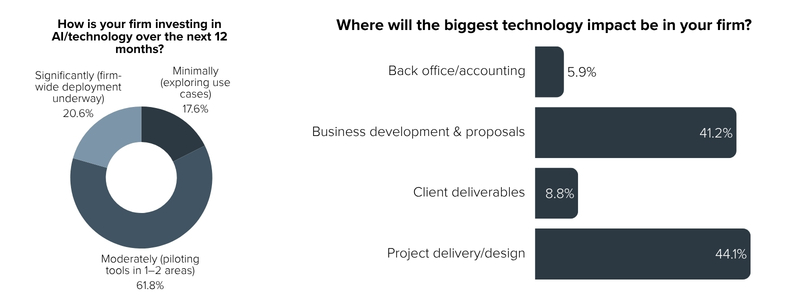
- Most firms have moved past the experimentation phase, with 82.4% of respondents reporting either moderate piloting in select areas or significant firm-wide deployment. Only 17.6% were still limited to exploring use cases.
- Investment is concentrated where it affects revenue generation, not back-office efficiency. Project delivery/design (44.1%) and business development/proposals (41.2%) are expected to see the biggest impact, while back-office functions trail at just 5.9%.
- AI strategy adoption is accelerating industry-wide, but unevenly. ACEC’s Engineering Business Sentiment Q1 2026 found that 47.0% of engineering firms now have an AI strategy in place, up 18 points from 2025, though adoption remains heavily tied to firm size, with 82.0% of large firms (more than 500 employees) having a policy versus just 11.0% of firms with 25 or fewer employees.
- The pattern holds in architecture as well. The AIA’s August 2026 Architecture Billings Index found that firms with annual billings over $5.0 million were significantly more likely to actively engage with AI, with 30.0% calling it a strategic priority.
“We will continue to leverage our AI investments to increase productivity and thus profitability.” – CEO of a multidisciplinary planning, engineering and environmental consulting firm
In Their Own Words: The 2027 Outlook
How do you expect your business conditions to change in 2027? Please address any of the following: backlog, profitability, end-market performance, labor, financing or macroeconomic factors.
What Respondents Are Saying
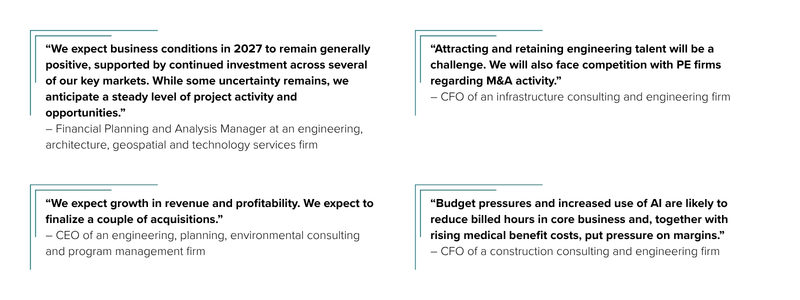
- Respondents are cautiously optimistic about 2027, with many expecting stable or improving backlogs, profitability and growth opportunities despite economic uncertainty and uneven end-market conditions.
- Labor and cost pressures remain the clearest risks. Firms frequently cited difficulty finding specialized talent, rising compensation and operating costs and client delays as potential constraints on growth.
In Their Own Words: Strengthening Position
If you could make one change to strengthen your firm’s competitive position in 2027, what would it be?
What Respondents Are Saying
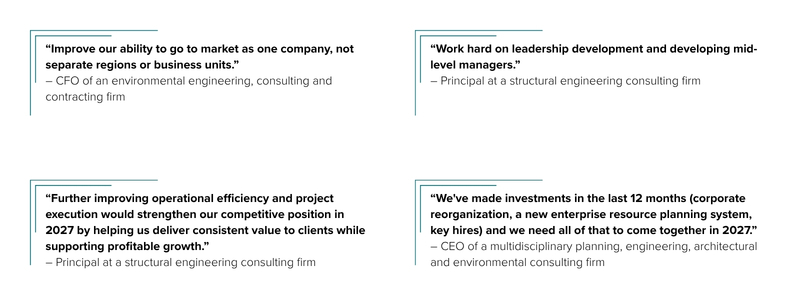
- Growth also depends on investments in people and market positioning, including key hires, leadership development, business diversification, broader geographic reach and stronger client relationships.
- Operational discipline is a leading priority, with respondents emphasizing cost control, project execution, financial awareness, accountability and more effective pricing as paths to stronger profitability.
- Technology is central to firms’ growth strategies. Respondents identified AI and other tools as opportunities to improve efficiency, strengthen proposals, enhance service delivery and differentiate their firms.
Conclusion
Prairie’s 4th annual Architecture & Engineering Survey suggests an ESOP-owned A&E sector entering 2027 with confidence. The inaugural Prairie ESOP A&E Confidence Index registered 75.0%, supported by strong expectations for overall business conditions, headcount growth, backlog and new project activity. However, more measured profitability expectations and persistent workforce constraints highlight the importance of disciplined execution, strategic technology investments and long-term ESOP planning.
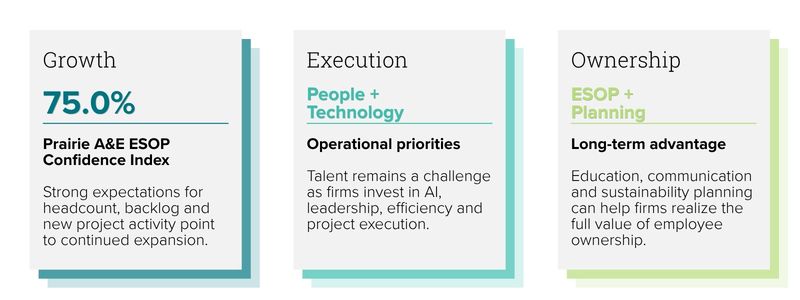
For ESOP-owned A&E firms, 2027 presents an opportunity to turn confidence into sustainable growth.
About the Survey
Survey Methodology
Prairie’s 4th annual Architecture & Engineering Survey examines the outlook, priorities and challenges of ESOP-owned architecture, engineering and A&E firms. The 2026 survey was conducted online from September 9 through September 22, 2026.
More than 530 executives at ESOP-owned A&E firms were invited to participate, including Prairie clients and prospective clients. Approximately 6.8% of those invited completed the survey, representing firms across a range of sizes, specialties and stages of ESOP maturity.
The 2026 survey builds on Prairie’s previous A&E research, expanding its focus on employee ownership and introducing the Prairie ESOP A&E Confidence Index, which measures expectations across six areas of business performance. Additional information about the index is provided on the Confidence Index page.
Survey Notes
- Responses were collected on an individual basis and treated as confidential.
- Not every respondent answered every question. Percentages therefore reflect responses received for each individual question.
- For questions allowing multiple selections, percentages may total more than 100.0%.
- Totals may not equal 100.0% due to rounding.
