
Snapshot
Selective Market, Durable Opportunity
The middle-market M&A environment remains active, but outcomes increasingly depend on the business, the buyer and the path to closing.
- Activity is steady, not accelerating broadly. Q2 volume stayed near the prior three second quarters, while aggregate deal value held firm.
- Private equity liquidity is concentrated. Exit value rose substantially on fewer transactions—larger exits, not a broad increase in completed sales, are driving the improvement.
- Valuations remain resilient but dispersed by size, sector and acquisition role; aggregate averages do not establish the value of an individual business.
- Financing is available, but more disciplined. New platforms face tighter leverage and higher borrowing costs, while add-ons can benefit from existing-platform credit facilities.
- The macro backdrop raises the execution bar. Higher yields, persistent inflation and energy-related geopolitical risk call for credible downside cases and financing plans.
- Preparation creates leverage. Durable growth, visible earnings, realistic expectations and execution readiness matter more than timing a broad rebound.
Transaction data through Q2 2026; market indicators as of September 30, 2026; inflation reflects August 2026. Sources: S&P Capital IQ; PitchBook; GF Data, an ACG Company; MT Newswires.
“Activity is steady. Buyers are selective. Execustion makes the difference.”
M&A Market Activity
Steady as We Go
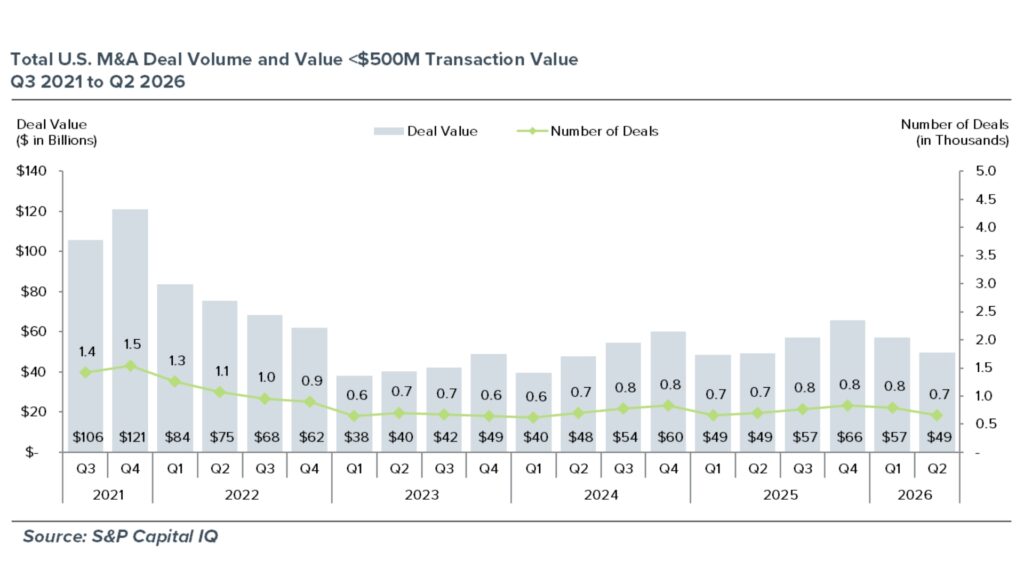
Middle-market activity has held a recognizable pace despite an unsettled backdrop—a picture of stability rather than broad acceleration.
- Q2 2026 recorded approximately 661 transactions and $49.5 billion of deal value in the U.S. market below $500 million.
- Transaction count was about 5% below each of the prior three second quarters—a modest decline within a consistent range.
- Deal value was essentially unchanged from Q2 2025 and above Q2 2024 and Q2 2023; steady dollars should not be mistaken for more transactions.
- First-half activity reached approximately 1,460 transactions and $107 billion, up roughly 8% and 9% from H1 2025, although Q2 eased from a stronger first quarter.
The market remains executable; owners should plan for a steady, selective environment rather than rising activity.
Private Equity Exit Activity
More Liquidity, Fewer Exits
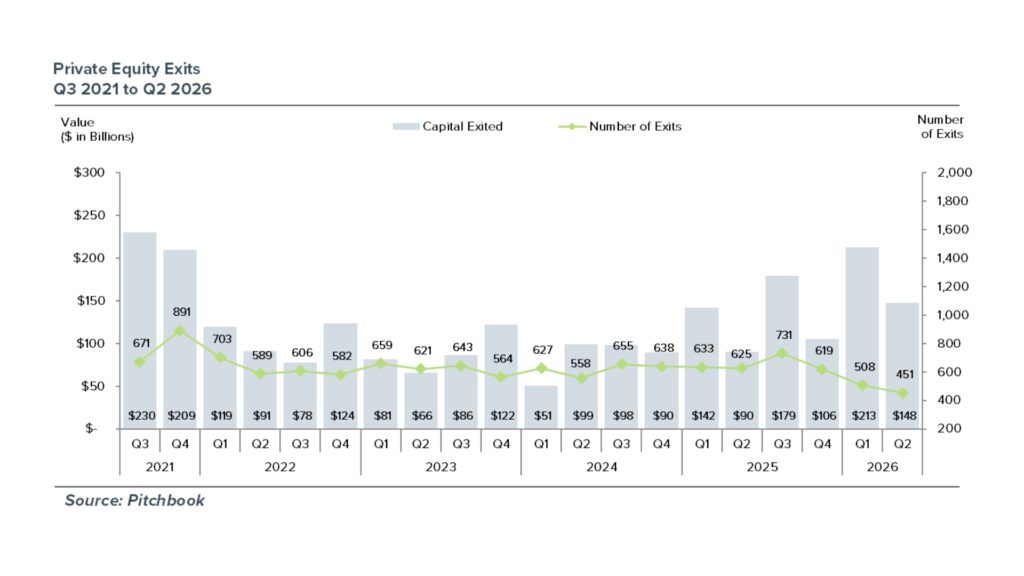
The exit market presents a different form of selectivity: substantially more value is being realized through fewer transactions.
- Q2 2026 recorded 451 exits, down 28% year-over-year, while aggregate exit value increased 64% to approximately $148 billion.
- The divergence extended across the first half: exit count declined approximately 24%, while exit value increased approximately 55% from H1 2025.
- Q2 produced the fewest exits of any quarter shown, yet value exceeded each second quarter from 2022 to 2025. An improvement in size, not breadth.
- For sponsors and portfolio-company owners, stronger aggregate liquidity is encouraging but does not mean every asset has an easier route to market.
Liquidity is returning unevenly; a credible investment case and executable process remain essential.
TEV / EBITDA by Deal Size
Stable Pricing Beneath a Changing Deal Mix
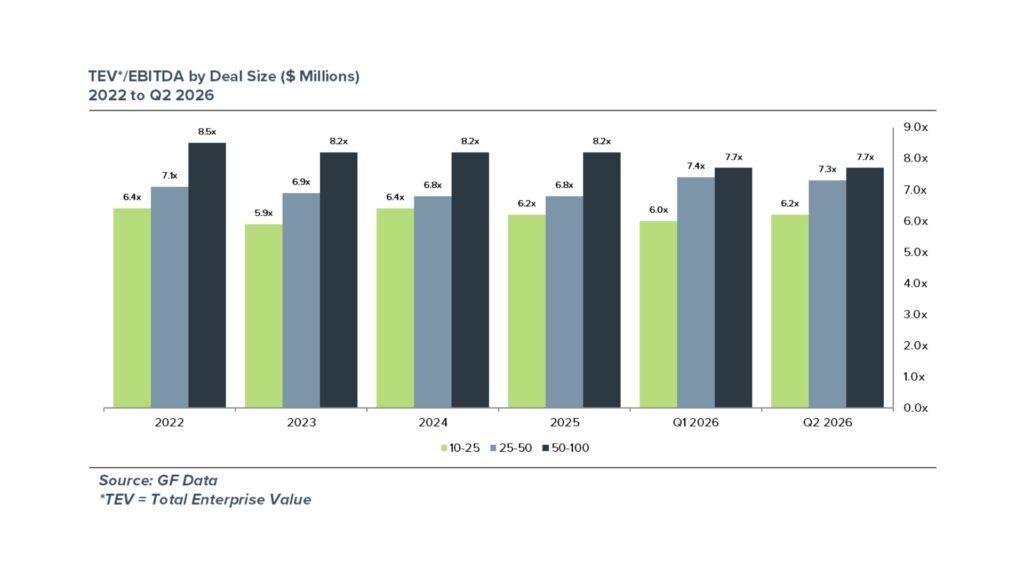
GF Data’s overall Q2 average declined, but its commentary attributes much of the movement to the mix of completed transactions rather than widespread repricing.
- The displayed cohorts moved little sequentially: +0.2x for $10–$25 million deals, –0.1x for $25–$50 million and unchanged for $50–$100 million.
- Year-over-year, the middle cohort improved 0.6x, the smallest was unchanged and the largest displayed cohort eased 0.1x—stabilization with pockets of strength.
- The overall average fell from 7.3x in Q1 to 7.0x in Q2; no $250–$500 million transactions closed, increasing the weight of smaller deals.
- First-half pricing of 7.1x remained close to 7.2x in 2024 and 2025; GF Data cites competition from committed funds and independent sponsors as support for pricing.
Benchmark against comparable size cohorts; a falling headline average does not establish value.
TEV / EBITDA by Buyer Type
Buyer Fit Can Change the Economics
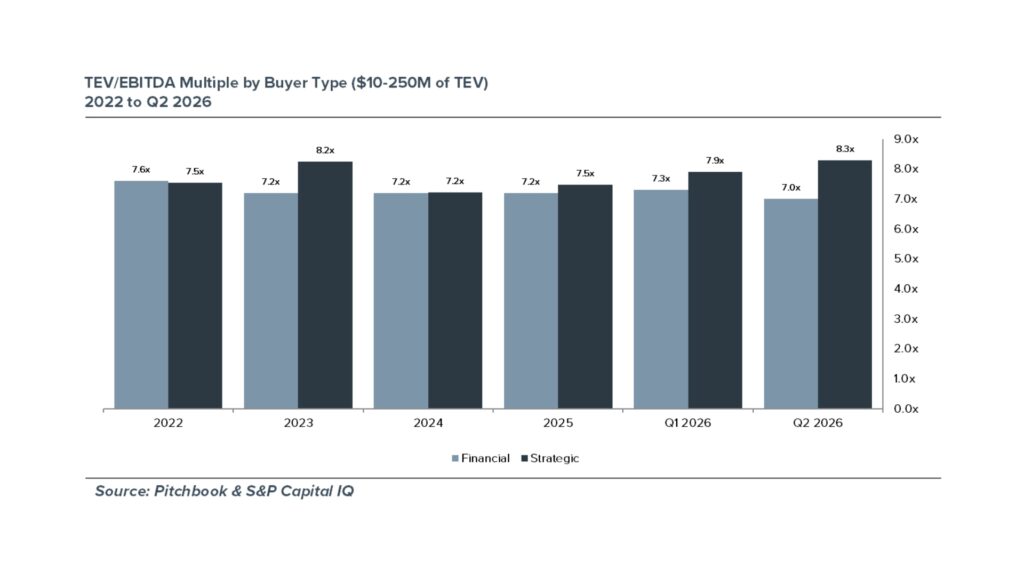
The buyer-type data suggests a widening valuation differential, but its mixed methodology warrants careful interpretation.
- The strategic series reached approximately 8.3x in Q2, up 0.4x sequentially, while the financial-buyer series declined 0.3x to 7.0x.
- The spread widened to approximately 1.3x, from 0.6x in Q1 and roughly 0.3x for full-year 2025—directional, not a like-for-like measure of willingness to pay.
- The strategic median rests on only 10 qualifying Q2 observations; size, sector and transaction mix may materially affect the result.
- Owners should build the buyer universe around demonstrable fit and capacity to execute rather than assume a strategic label guarantees a premium.
Buyer fit matters, but an individual buyer’s economics and financing plan matter more than the category average.
Buyer & Sector Dispersion
Business Services Regains Momentum
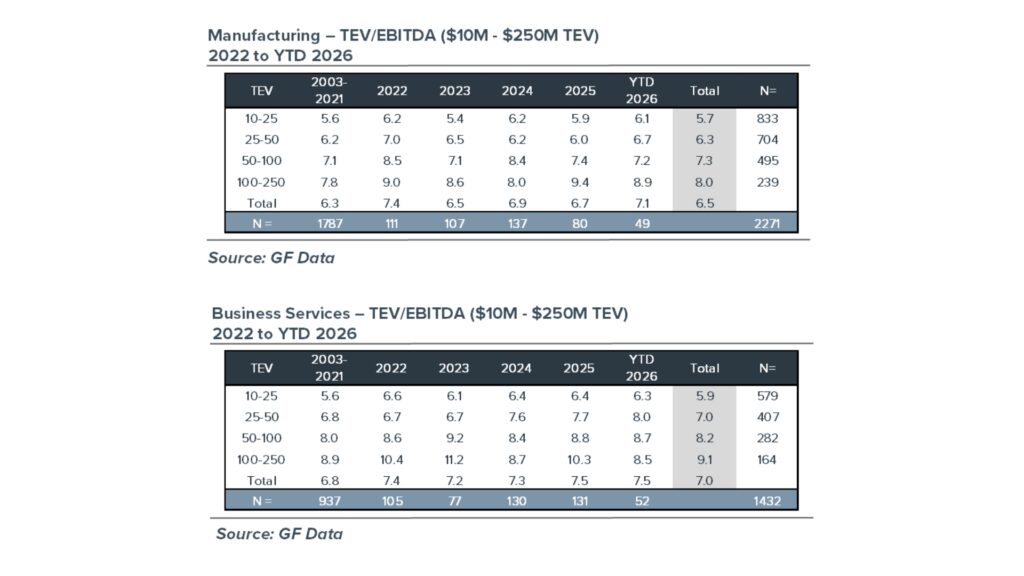
The sector comparison reinforces the same message: strength is selective, and transaction size can change the apparent industry premium.
- Through Q2, Business Services averaged 7.5x versus 7.1x for Manufacturing—first-half averages, not standalone Q2 multiples.
- Business Services led by 1.3x for $25–$50 million deals and 1.5x for $50–$100 million deals, but trailed Manufacturing by 0.5x for $100–$250 million transactions.
- Business Services recorded 27 Q2 transactions versus 25 in Q1, with pricing improving across nearly every size range; Manufacturing recorded 23 versus 26.
- GF Data describes Manufacturing’s recovery as principally B2B-driven; consumer-manufacturing observations remain limited and volatile.
- First-half senior leverage on Manufacturing platforms averaged 2.4x versus 2.1x for Business Services, consistent with selective lender re-engagement with industrial credits.
Assess the specific subsector, business model and financing profile—not the industry label.
Leverage & Capital Structure
Financing Remains Available, but Selective
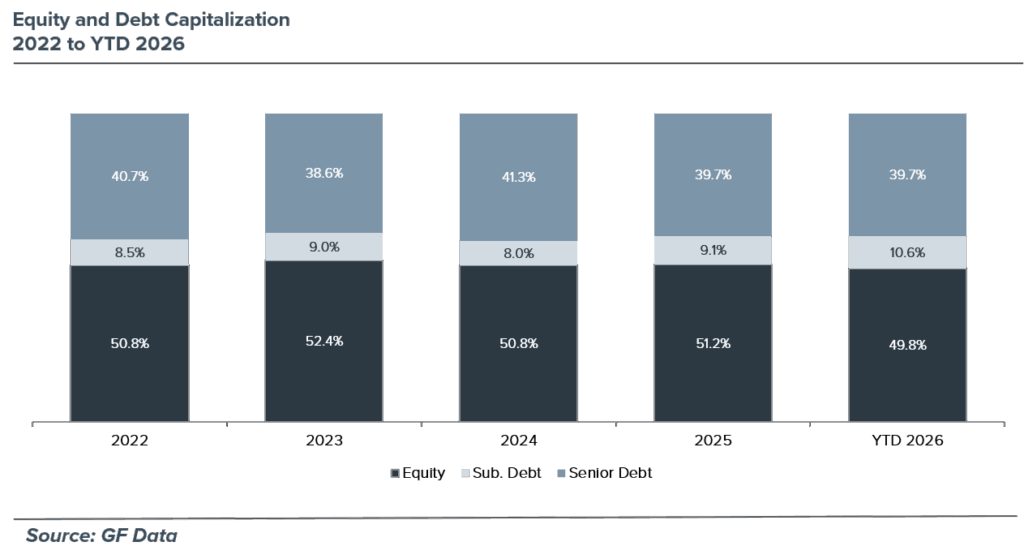
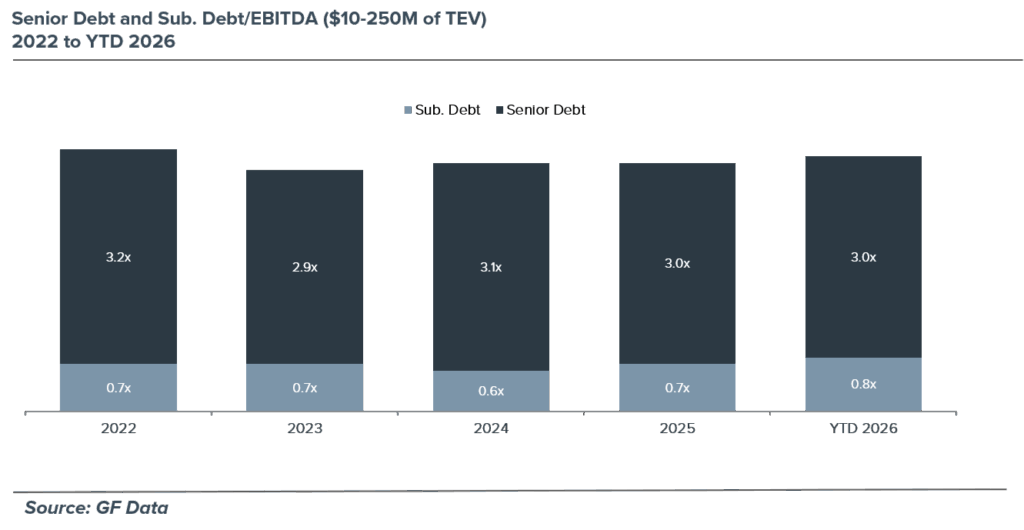
Aggregate debt capacity has held up, but new platforms face a more constrained picture—making transaction structure increasingly important.
- Junior debt gained share: subordinated debt reached 10.6% of first-half capitalization, up 1.5 points from 2025, as equity eased to 49.8% and senior debt held at 39.7%.
- Aggregate leverage totaled 3.8x EBITDA through Q2—3.0x senior and 0.8x subordinated—slightly above full-year 2025.
- New-platform leverage tightened in Q2: total debt fell to 2.9x from 3.4x and senior debt to 2.0x from 2.5x.
- Add-ons benefited from existing-platform facilities, with first-half senior leverage of 4.5x versus 2.3x for platforms.
- Senior debt pricing rose 60 basis points sequentially to 7.8%, though it remained below Q2 2025; sellers should weigh funding certainty alongside headline value.
Financing capacity is transaction-specific; structure, lender selection and full borrowing cost determine how far buyers can stretch.
Capitalization and leverage are distinct measures. YTD all-deal averages, quarterly platform readings and pricing samples are not directly interchangeable.
Macro & Geopolitical Backdrop
Higher Rates and Energy Risk Raise the Executive Bar
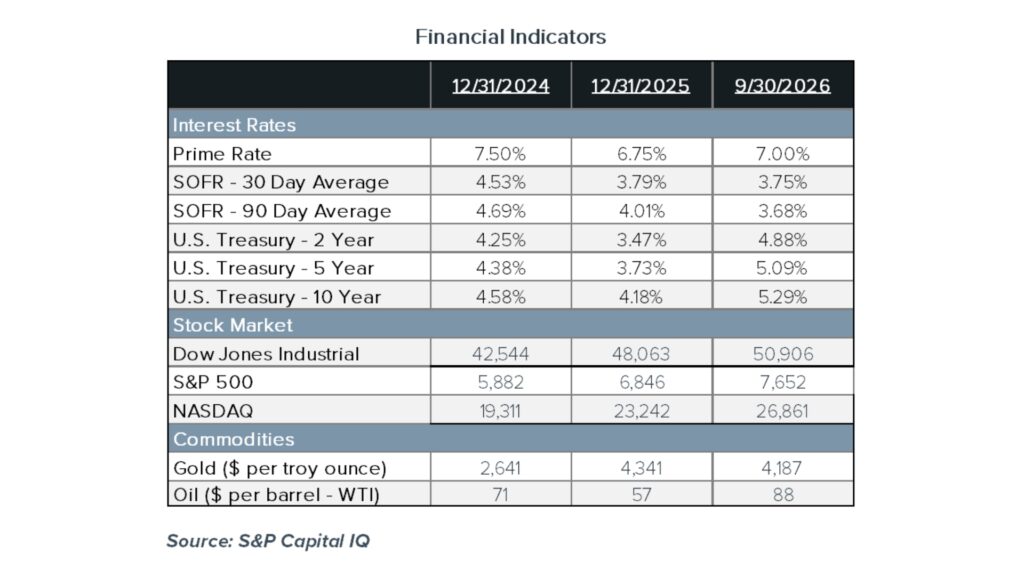
The macro backdrop adds pressure to an already selective financing environment, reinforcing downside protection over assumptions of rapid relief.
- Since year-end 2025, the 10-year Treasury has risen 111 basis points and the 2-year 141 basis points, raising financing and refinancing hurdles; actual borrowing costs depend on spreads, structure and hedging.
- August headline and core PCE inflation held at 3.4% and 3.0%; September’s Fed hike and expectations for further tightening argue against underwriting near-term rate cuts.
- Iran-related conflict and unresolved Hormuz negotiations sustain energy and shipping uncertainty; exposed businesses and cross-border transactions warrant contingency planning.
- WTI oil price ended September roughly 55% above year-end 2025, supporting producers while pressuring transportation costs, manufacturing margins and consumer purchasing power.
Uncertainty raises the hurdle; it does not eliminate opportunities supported by durable earnings and credible financing.
Implications for Business Owners
Readiness Matters More Than Market Timing
The preceding analysis points to a decision framework—not a blanket recommendation to sell now or wait.
- Assess readiness before timing. Owners with durable performance, credible management and clear objectives may have reason to test the market; businesses facing slower growth, concentration or margin pressure may benefit from addressing those issues first, although refinancing needs can make delay costly.
- Build a defensible investment case around growth, visible revenue, margins, customer diversification and positioning. GF Data’s defined quality premium was only about 5%, below historical norms.
- Prepare the evidence early: quality-of-earnings support, normalized working capital, strong reporting and management depth, customer and supplier review, and lender-ready projections.
- Match the transaction to the objective—full sale, strategic or PE process, recapitalization, sale as an add-on, or continued ownership. No route is automatically superior.
- Evaluate executable proceeds: financing certainty, cash at closing, rollover, contingent consideration, working-capital terms and timing—not just headline price.
Prairie’s practical recommendations, not guarantees of valuation or timing. Source: Prairie interpretation of GF Data, an ACG Company — Q2 2026 M&A and Leverage Reports.
“Pursue the transaction the business can support and the buyer can execute.”
Prairie Outlook: Fall 2026
Opportunity Remains. Execution Matters
The evidence supports a constructive but measured view of the months ahead.
- The market is open, but selective. Completed transactions and resilient pricing support a constructive view—not an assumed broad-based rebound.
- Value depends on the business and the buyer. Differences by size, sector and acquisition role reinforce realistic expectations and a carefully built buyer universe.
- Capital is available, but discipline is essential. Higher borrowing costs and tighter platform leverage favor credible financing plans; existing-platform facilities can give add-ons an advantage.
- Make the investment case tangible: durable growth, visible revenue, strong margins and defensible positioning, supported by clean reporting and capable management.
- Prepare for the right transaction, not the perfect market. Align owner objectives, buyer fit, financing capacity and execution readiness before launching a process.
A constructive interpretation of current evidence, not a forecast of activity or valuation. Sources: S&P Capital IQ; PitchBook; GF Data, an ACG Company; MT Newswires.
“Attractive outcomes remain achievable – preparation and a credible path to closing matter more than waiting for a broad recovery.”
Tim Witt is a Managing Director and can be contacted at 630.413.5593 or by email, tim.witt@prairiecap.com; Anthony Dolan is a Managing Director and can be contacted at 630.413.5587 or by email, adolan@prairiecap.com.
Download the PDF above.
